A. Martyn Ainsworth, Paul F. Cannon, Bryn T. M. Dentinger
Mycokeys (archived)
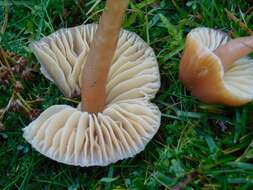
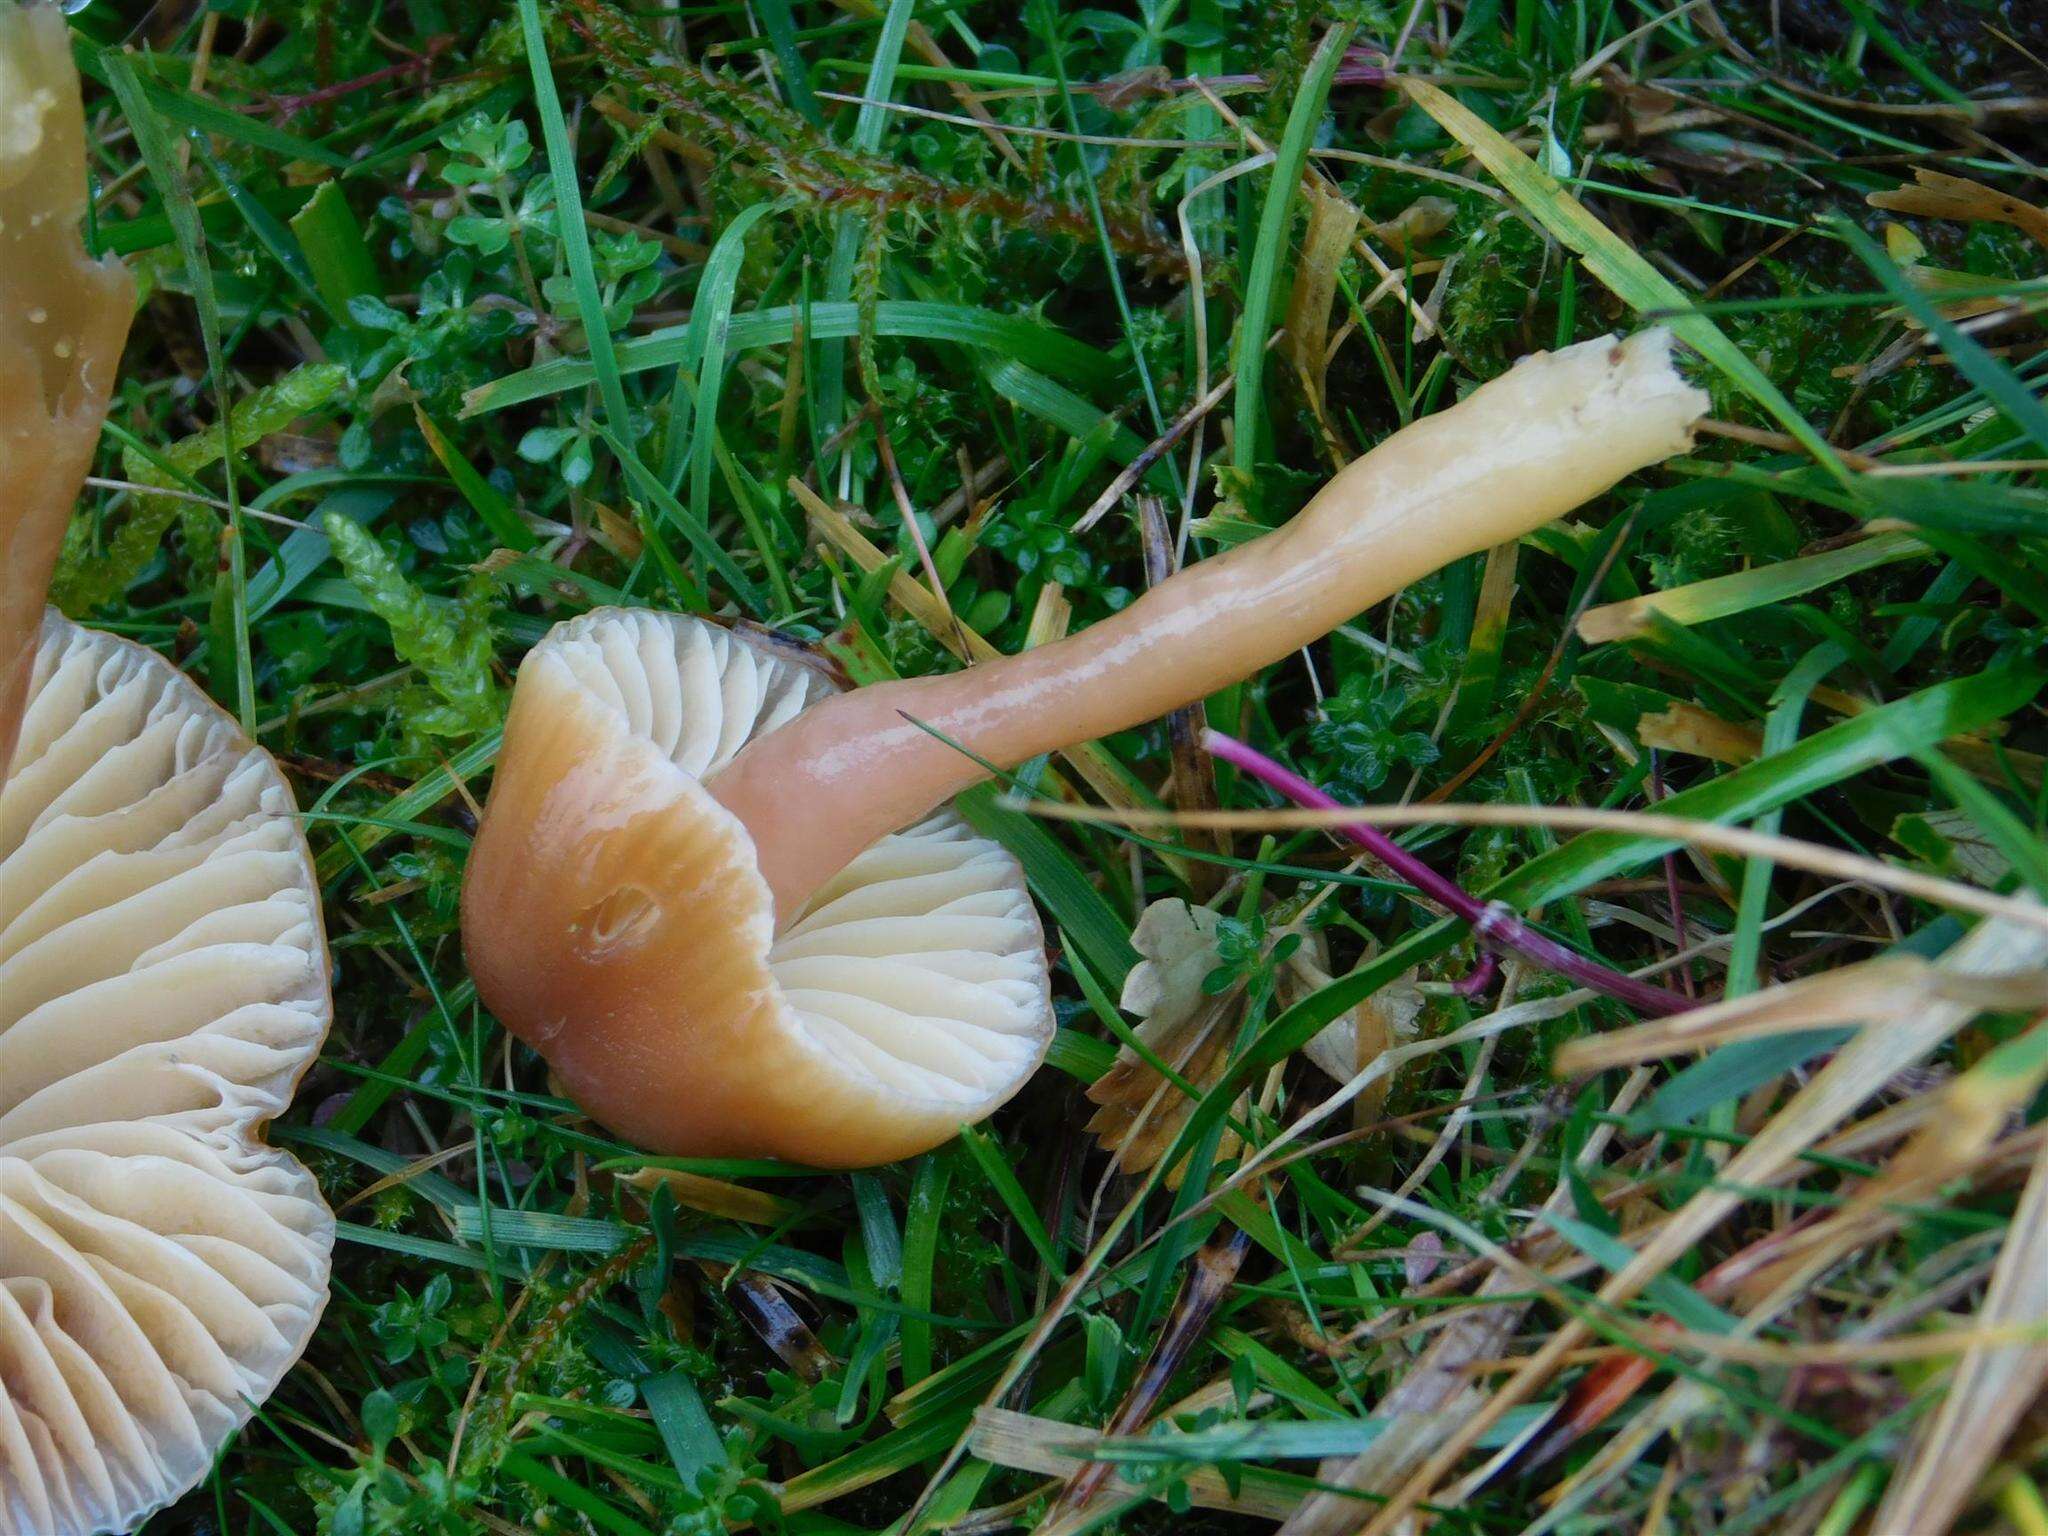
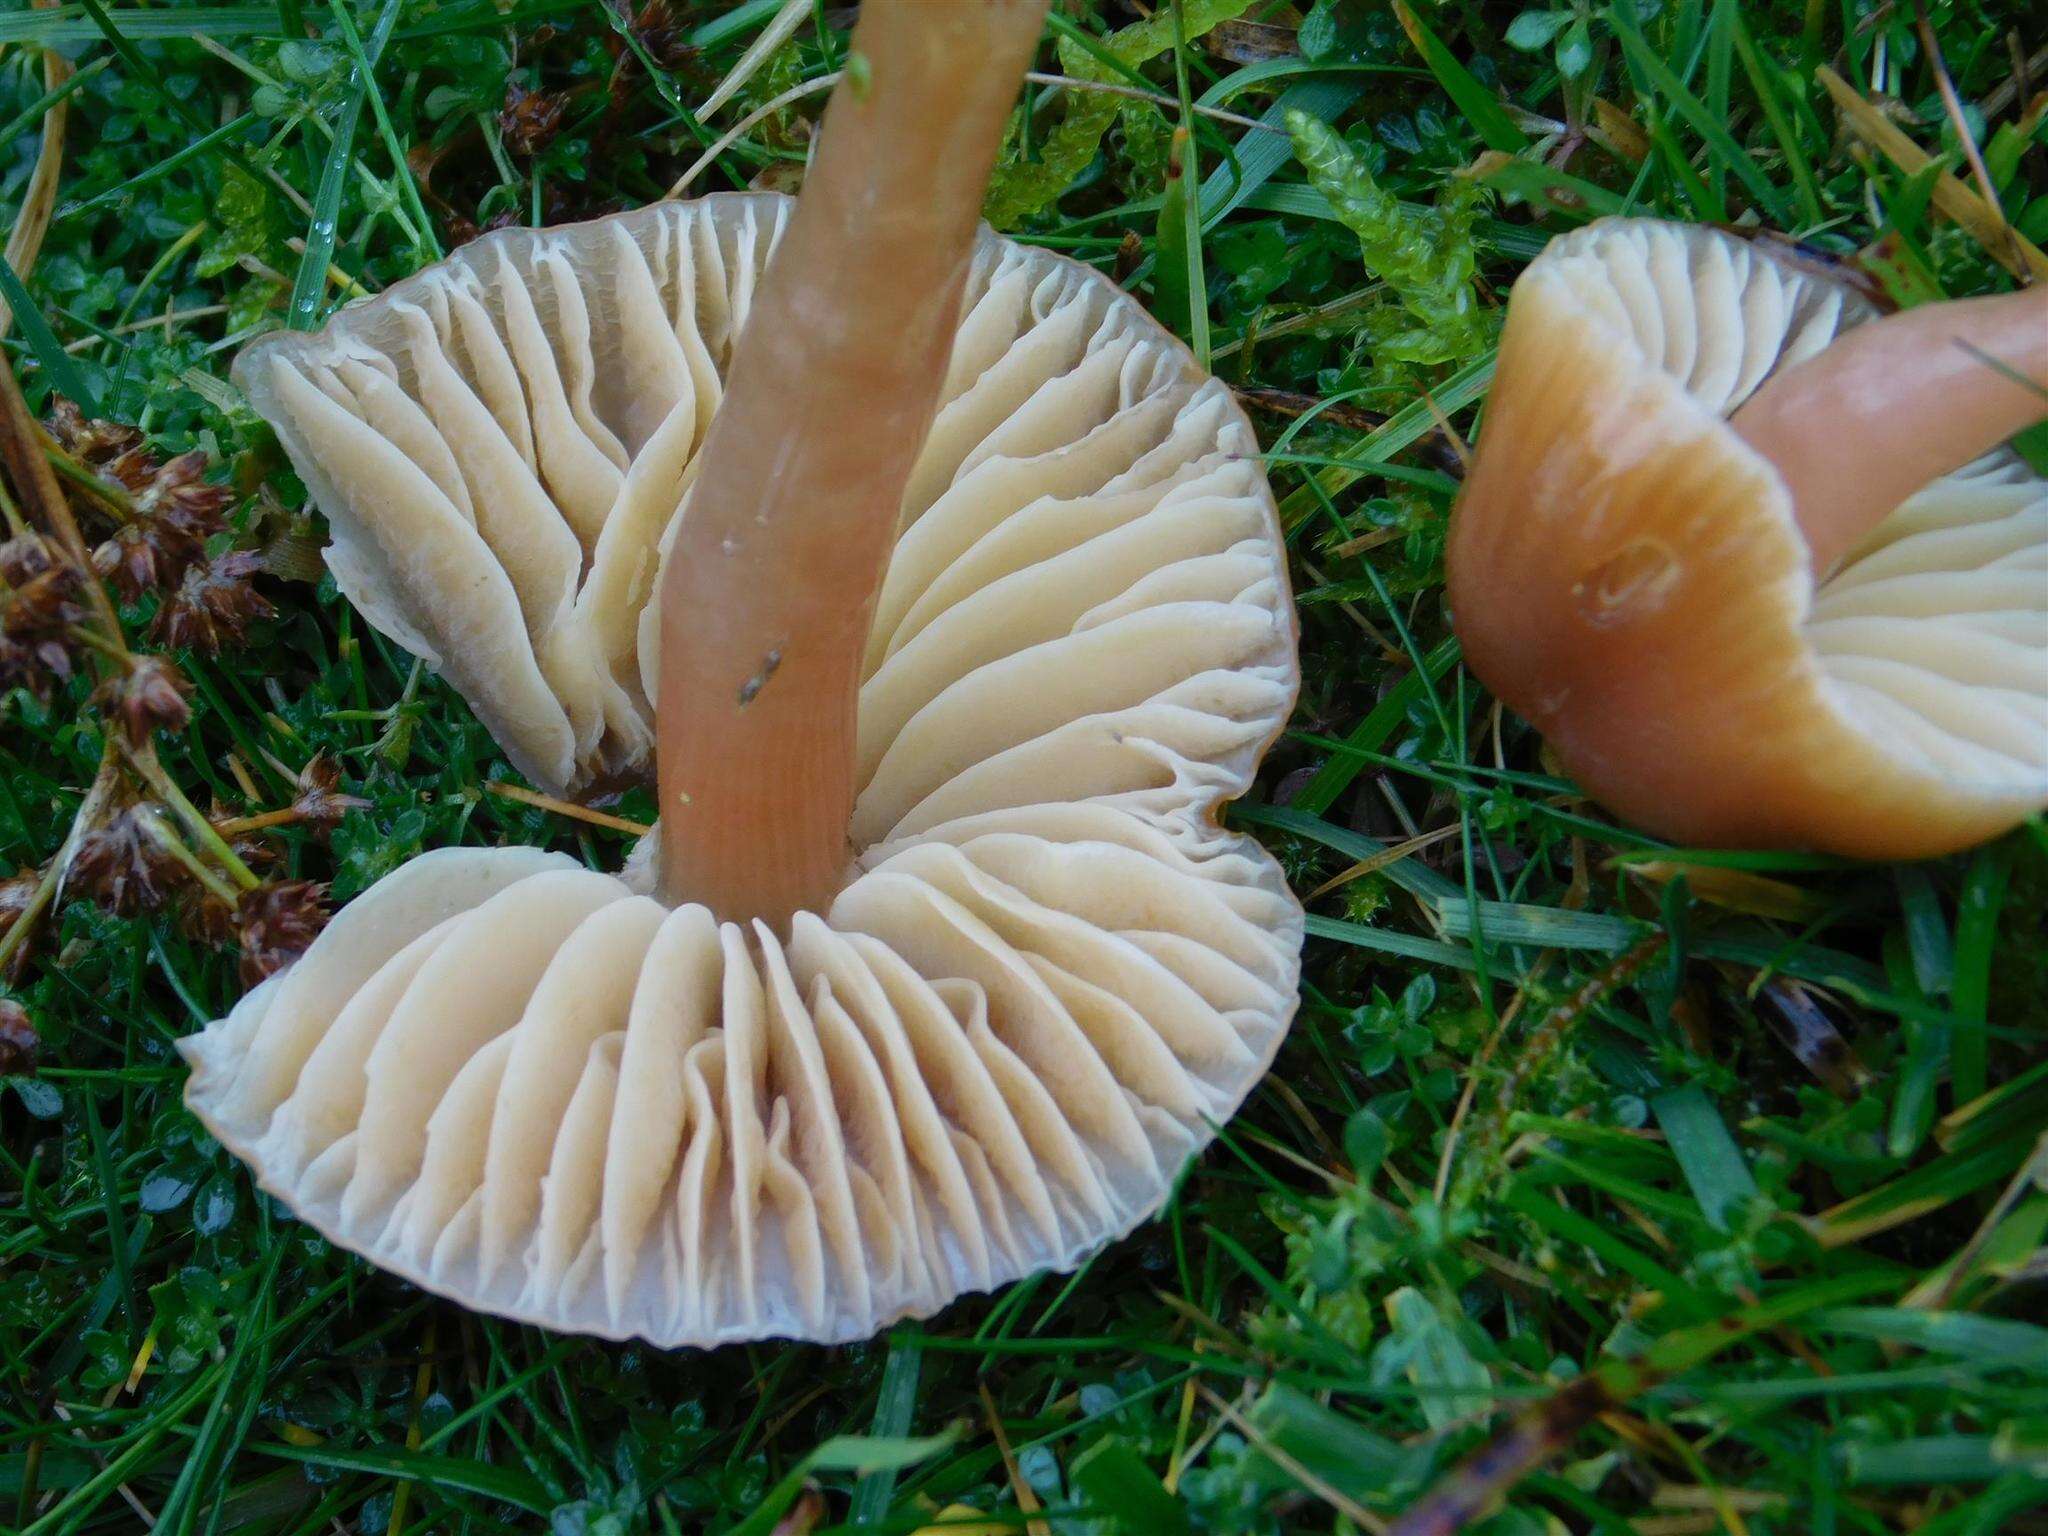
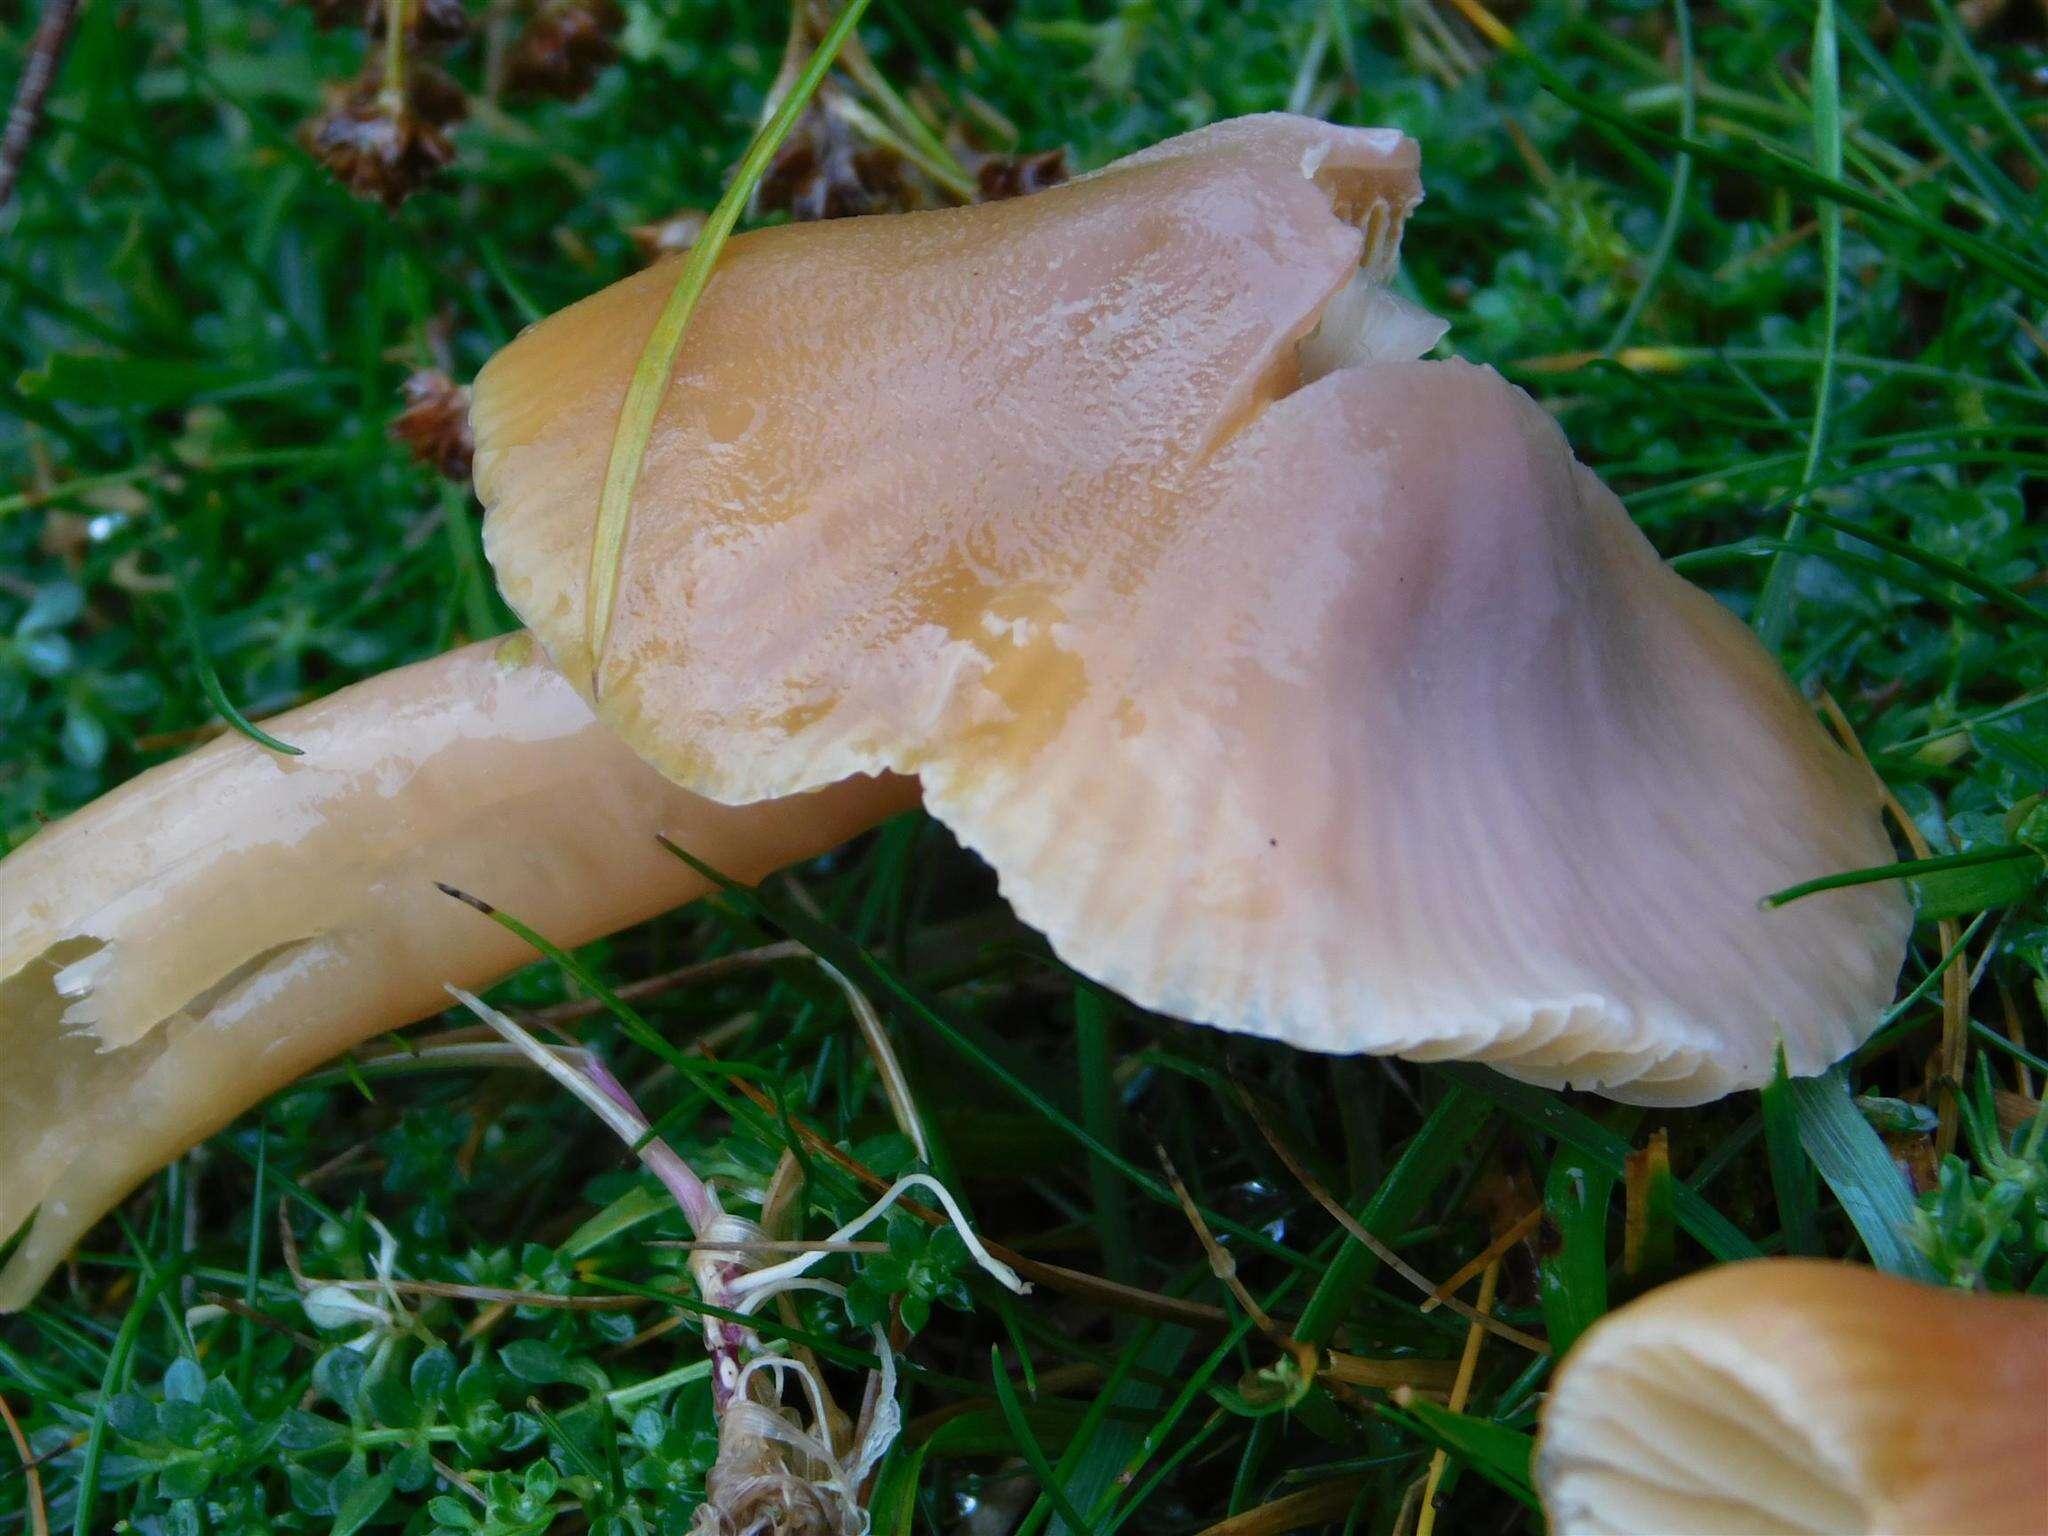
Figure 4.Basidiomata of Gliophorus europerplexus, scale bars represent 10 mm. Photographs A–D by D.J. Harries taken in situ at, or of collectionsfrom, the type locality, and E by B.T.M.D. A, B K(M)181245* C, D K(M)181246* holotype E K(M)181241*.
A. Martyn Ainsworth, Paul F. Cannon, Bryn T. M. Dentinger
Mycokeys (archived)
Figure 5.Microscopic characters of Gliophorus europerplexus, A mounted in Melzer’s Reagent and B–D(holotype) in Congo Red, scale bars represent 10 µm. A Spores from lamellar squash K(M)181241*B Subregular lamellar trama from squash mount K(M)181246*C–D Basidia K(M)181246*.
A. Martyn Ainsworth, Paul F. Cannon, Bryn T. M. Dentinger
Mycokeys (archived)
Figure 6.Distribution of Gliophorus reginae (●) and Gliophorus europerplexus (▲) in Britain based on sequenced collections and plotted using SimpleMappr (Shorthouse 2010).
A. Martyn Ainsworth, Paul F. Cannon, Bryn T. M. Dentinger
Mycokeys (archived)
Figure 1.Maximum likelihood phylogram using full and partial nuclear ribosomal internal transcribed spacers (ITS) sequences. Numbers above branches are nonparametric bootstrap values. Tree is arbitrarily rooted at the midpoint. Two well-supported terminal clades representing the new species Gliophorus reginae and Gliophorus europerplexus are superimposed over light grey boxes. Species names for specimens from which sequences were derived are followed by fungarium or INSD accession number, and geographic location. Notations (H) and (P) indicate specimens used were holotypes or paratypes, respectively.